|
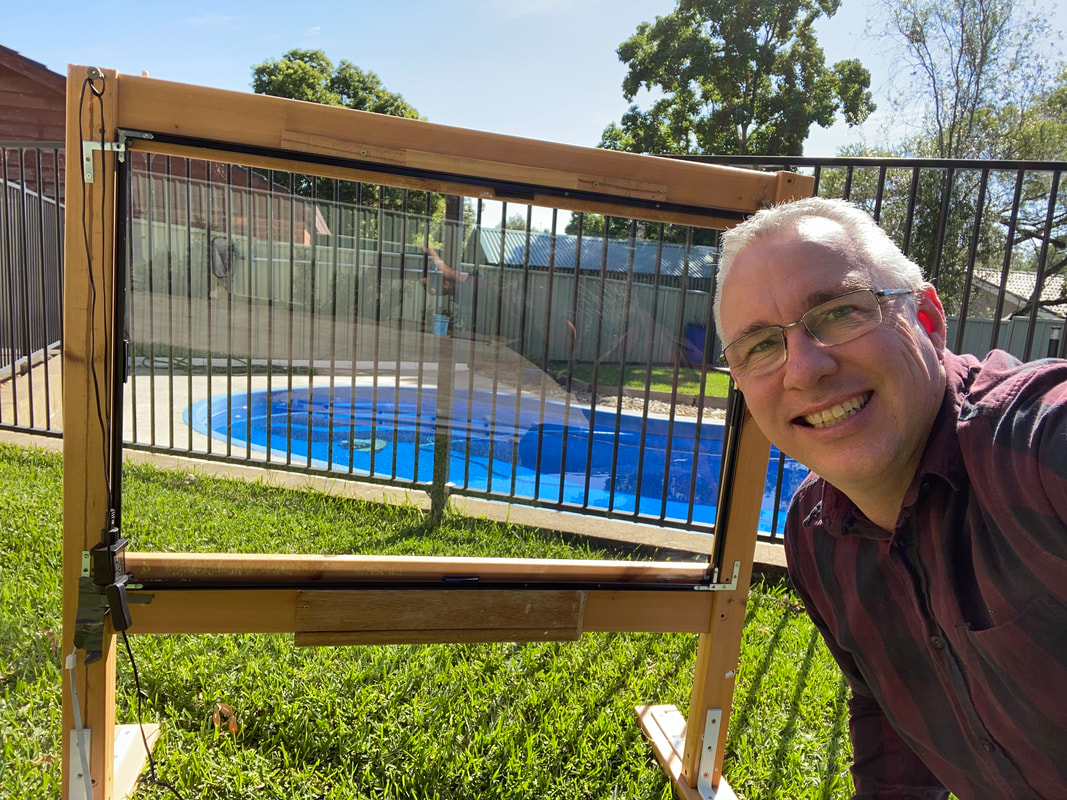
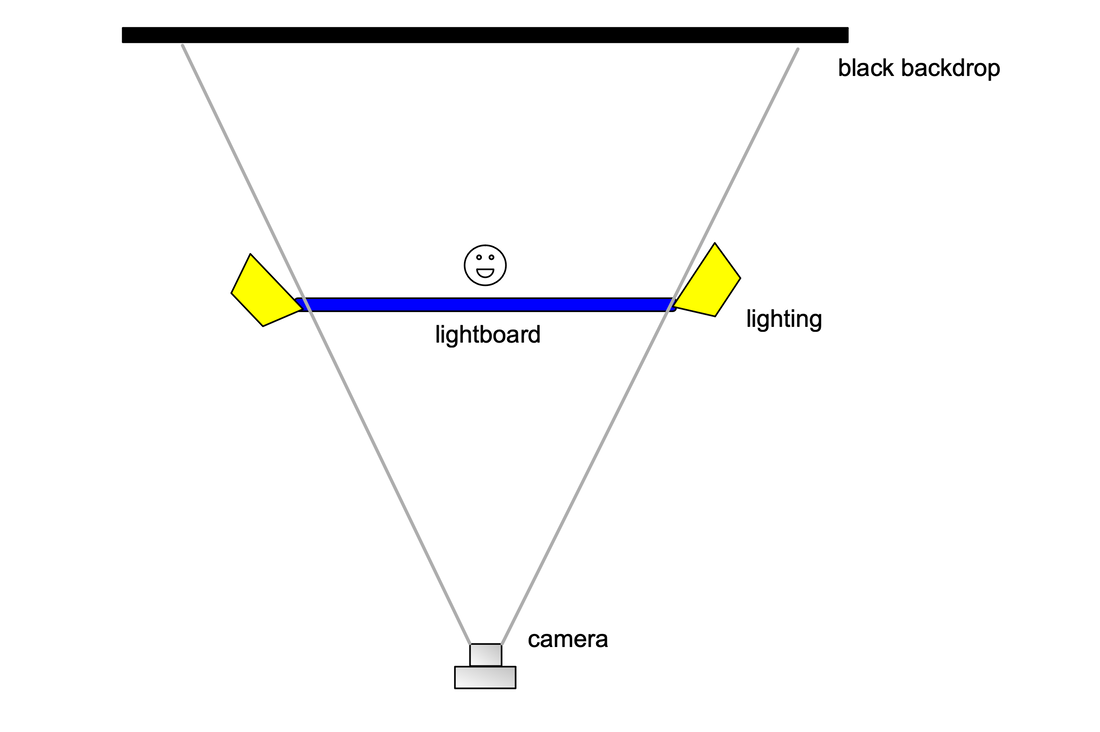
Instructional videos, especially those that involve writing on a board or screen, are easy to produce for educators. This is especially true for mathematics and physical science courses where equations need to be explained. A common way is to simply set up a camera towards a blackboard or white board and simply record yourself writing and speaking. Although quite basic technically, this method suffers in that you aren’t actually looking at the camera when you are doing the writing. Another method, employed by a number of educational channels is to write on a screen/computer and then record this. You hear the presenter, but don’t see them, as you see the writing on the screen. However, there no “human” evidence, either the hand writing, or the person talking. There is some research on the efficacy of this instructional method and the presence of a hand, or better still, the presenter, leads to improved engagement and therefore retention of content. It’s this reason why a number of presenters simply film their writing on paper from above as a way of communicating. One alternative method involves the use of a light board and it’s the way I have been producing content where I simply need to “instruct as I write”. The concept is fairly simple, though has a little more preparation required. The presenter writes on glass with a fluorescent whiteboard marker with the camera on the other side of the glass. This way the presenter is looking straight at the camera whilst writing. Of course, you will ask, do you have to write in reverse? No you don’t, you simply write normally, but to address the reversed image, when you edit the video, you flip the video horizontally. So now it’s the correct way round, and if you are right handed, you’ll appear left handed! My rough and ready effort. Clearly I am not a designer, but it works just fine. Obviously not where I use it! There are a few things to consider.
Other tips
Some links
0 Comments
or A LESSON UNITS, UNCERTAINTY AND SIGNIFICANT FIGURESI find students when they start a physics course, have a weak understanding of how measurement works and how values are discussed, and so I cover key concepts of units, uncertainty and quoting of significant figures, before I start the physics course proper.
What follows is a an activity I do with the students over the course of 1-2 hours. (I include some thoughts in red) Determining the Density of a pice of paper Divide your class into groups of 3 Give each group a single sheet of A4 (or 'letter') sheet of paper and ask the to determine its density as accurately as possible. Give as little instructions possible but provide them only a meter ruler and access to a set of digital scales. Finding the length and width is relatively straight forward, but the thickness is another matter. I find the students generally fall into two camps, they either fold the paper multiple times to ge a thicker section (which has its limitations) or they ask for a stack of paper and measure that (again, the size of the stack contributes to uncertainty) Once they determine the dimensions and the mass, and thus calculate density, get them to write their answer on the board. When I survey their responses, most get similar 'numbers', however, there will be some with different units (I insist on them quoting units) and many over quote significant figures. So as I discuss the results in the class I ask "Are these results the same?" To the ones who over quote numbers, I ask "how confident are you of those number?" I then ask about the thickness measurements, "How certain are you about the number being that precise value?" This then all leads to a discussion on - talking the same 'language' - SI units - how we express our uncertainties - the role of significant figures (check out my video here) At this point , teach the points measured above, including how to express uncertainties Once you have covered the concepts , get students to repeat the task, but prior, teach them how to use a micrometer. Students now need to determine the density, using same units, and quoting with % error and in correct significant figures. When results are compared on the board, all their results should fall within the uncertainty of the over the results (hopefully :) ). This could be graphed to make it more clear. Feel free to provide feedback below and any modifications you tried |
AuthorTeacher, YouTuber, Archives
November 2021
Categories
All
|
|
© COPYRIGHT 2024.
ALL RIGHTS RESERVED. |


 RSS Feed
