When we wish to analyse the motion of an object - whether it is moving at a constant velocity or constantly accelerating - a useful way to visualise the motion is by drawing graphs.
We can graph one of three variables with respect to time - displacement, velocity and acceleration.
Not only can we directly see the trend of any of these variables, we can INFER the other variables, by examining the sloper and/or area under the graph.
Interactive
Start by playing with the following animation.
Move the sliders which set the initial conditions of an objects motion.
Can you see any trends as you move the sliders?
Credit Geogebra interactive by Tom Walsh
|
|
THEORY
Now lets address the theory by watching this video. In this video, I use the animations from pHET I explain the graphs generated from three times of motion, stationary, constant velocity and constant acceleration. I also discuss how you can determine variables such as velocity displacement and acceleration from these graphs. |
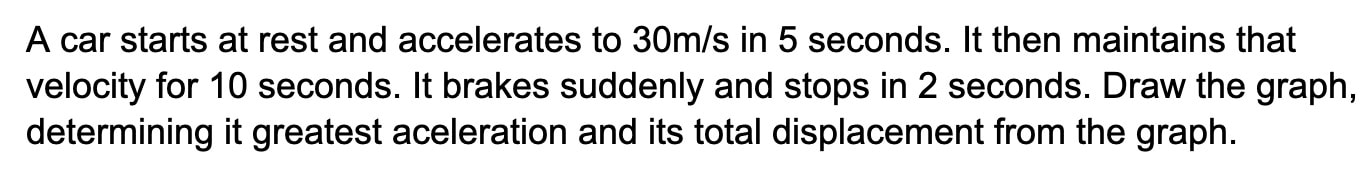
Sample Problem
Below is a sample problem with a video that explain how to solve it. It is suggested you try the problem beforehand, as this actually aids understanding, even if you are unsure if you are correct.
Below is a sample problem with a video that explain how to solve it. It is suggested you try the problem beforehand, as this actually aids understanding, even if you are unsure if you are correct.
|
|
|
|
EXTENSION
Graphs not only allows us to visualise what is occurring in terms of motion. We can also use the graphs as a mathematical way to establish mathematical models or equations. So we can derive equations of motion from graphs of motion. In this video, I show you how the equations of motion can be derived from a basic understanding of motion graphs |
RESOURCES
Here are some other useful links that provide animations to examine motion graphs
Here are some useful worksheets which you can download. These I have collected from a variety of places.
Here are some other useful links that provide animations to examine motion graphs
- pHET graphing animation - this interactive from the University of Colorado pHet team is a great way to demonstrate the relationship between motion and its graphical analysis. That why I used it in my video. At this time its Java based so will only work on PC/Mac
- Walter Fendt interactive on motion graphs - another good simulation and is HTML5 based so will work on all devices
Here are some useful worksheets which you can download. These I have collected from a variety of places.